Dashboard overview
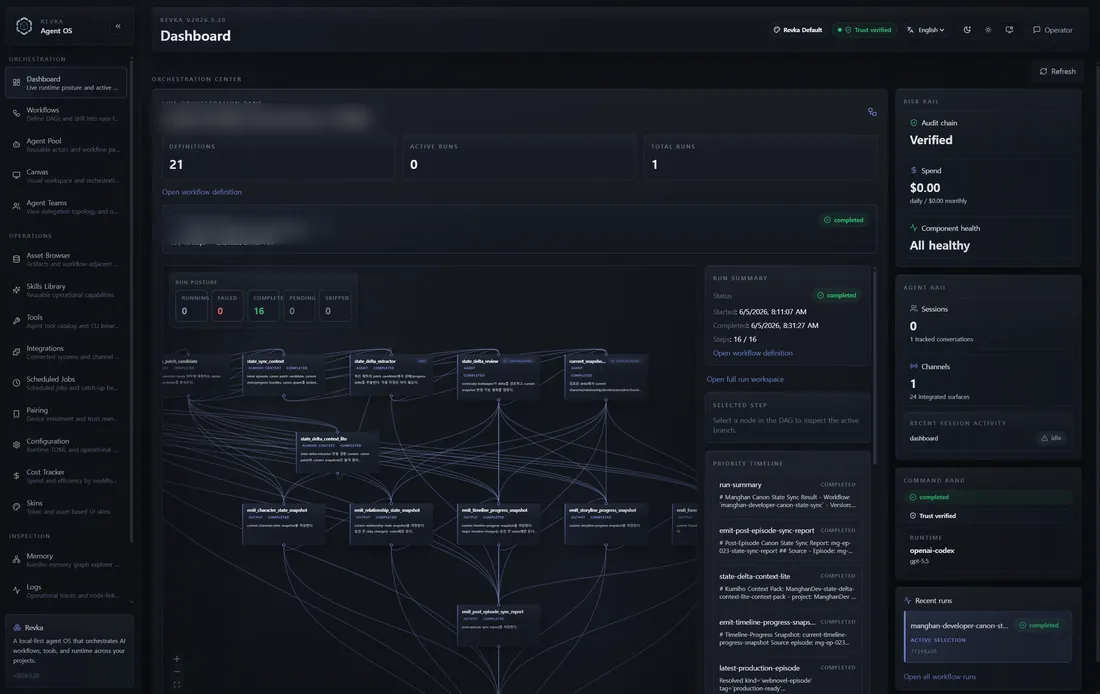
The orchestration landing page: DAG canvas, rail cards, audit badge, metric strip, and hotkeys.
The Dashboard page (/dashboard) is the operator landing screen — where you arrive after pairing your browser. It shows the live runtime posture of your most recent workflow run in a single two-column view: a read-only DAG canvas on the left and a stack of rail cards on the right. Use it as your at-a-glance command center: which steps are failing, whether the audit chain still verifies, what you’re spending, how many sessions and channels are active, and which provider and model are answering.
This page covers what each surface shows, the keyboard navigation, and the deep-link parameters you can use to jump straight to a run or step. To get here in the first place, start the gateway and pair a device — see Run the dashboard. For a page-by-page tour of every other route, the same guide carries the full route map.
Layout
Section titled “Layout”The Dashboard is laid out as a metric strip across the top, a DAG workspace filling the left column, and a right rail of cards. Everything below is read-only — the Dashboard never mutates a run. To approve, retry, cancel, or delete a run, follow a link through to Workflows, editor & runs.
When you open the page it selects the most recent run automatically. You can change the selection from the Recent Runs card, or pin a specific run with a deep-link parameter.
Metric strip
Section titled “Metric strip”A row of three counters summarizes your workflow estate at a glance:
- Definitions — how many workflow definitions exist.
- Active runs — runs currently in
runningorpausedstate. - Total runs — the lifetime run count.
These come from a single aggregate call so the page does not fan out into separate definition and run requests:
GET /api/workflows/dashboardAuthorization: Bearer <token>{ "dashboard": { "definitions_count": 12, "definitions": [ ... ], "active_runs": 2, "recent_runs": [ ... ], "total_runs": 47 }}DAG workspace
Section titled “DAG workspace”The center column renders the selected run as a read-only @xyflow/react graph: one node per step, edges for dependencies. Click a node to select it — the Selected step card on the right updates with that step’s detail. The canvas is for inspection only; you cannot edit topology here (that lives in the workflow editor).
An overlay on the graph shows run posture:
- Count chips — a tally of steps by status (running, failed, blocked, completed, and so on).
- Hotspot chips — signal chips that call out the steps demanding attention so you can spot trouble without scanning every node.
The graph data is the full run detail, fetched for the selected run, with its pinned definition resolved so node labels match the YAML that actually executed:
GET /api/workflows/runs/{run_id}Authorization: Bearer <token>GET /api/workflows/revisions/{revision_kref}Authorization: Bearer <token>Priority timeline
Section titled “Priority timeline”Below or alongside the graph, a scrollable priority timeline lists every step in the selected run with status colour-coding. It is the linear companion to the graph: use the timeline to read steps in order, and the graph to read them by dependency.
Run summary and selected step cards
Section titled “Run summary and selected step cards”Two inspector cards describe the current selection:
- Run summary —
run_id, workflow name, a status pill, and step counts for the whole run. - Selected step — the role,
agent_type, template, and an output preview for the step you clicked in the DAG.
Right rail cards
Section titled “Right rail cards”The right rail stacks four cards that pull live posture from across the gateway. Each refreshes independently, so a slow or disabled subsystem degrades gracefully rather than blanking the page.
Risk Rail
Section titled “Risk Rail”The risk card is your security-and-spend snapshot. It combines three signals:
- Audit chain badge — verified or invalid (see below).
- Cost summary — current spend, from the cost ledger.
- Degraded components — a count of health components reporting
error.
GET /api/costGET /api/statusAuthorization: Bearer <token>The cost endpoint needs no auth — it is read-only operator telemetry, and returns a zeroed summary (rather than an error) when cost tracking is disabled. The status call is authenticated; degraded-component and provider/model detail come from it. See Cost, audit, ClawHub & credentials API for the full cost shape and Status, health, config & tools endpoints for status.
Agent Rail
Section titled “Agent Rail”The agent card shows how many active sessions and active channels the runtime has open right now:
GET /api/sessionsAuthorization: Bearer <token>GET /api/channelsAuthorization: Bearer <token>Command Band
Section titled “Command Band”The command card shows the provider and model identity currently in effect, plus quick links into the rest of the dashboard. The identity is read from the authenticated GET /api/status response.
Recent Runs
Section titled “Recent Runs”The recent-runs card lists the last several runs from the dashboard aggregate. Click any run to select it in the DAG workspace, or use the Open all runs link to jump to the full Runs page at /runs.
Operator Brief
Section titled “Operator Brief”Above the rails, a skinnable Operator Brief hero banner shows a tone-aware message that tracks overall posture — idle, running, failed, or error. Its imagery comes from the active skin’s dashboardHero asset slot; see Logs, audit, doctor, pairing & skins pages for skins.
Audit chain badge
Section titled “Audit chain badge”The Risk Rail carries a tamper-evidence badge for the audit log. A green shield means the on-disk hash chain verifies end to end; a red shield means it is broken (or auditing is off). It is backed by:
GET /api/audit/verifyAuthorization: Bearer <token>{ "verified": true, "entry_count": 1842 }On a broken chain — or when auditing is disabled — the response is verified: false with an error describing the failure:
{ "verified": false, "error": "chain broken at sequence 41" }The Dashboard re-runs this check every 60 seconds and again whenever the browser tab regains focus, so a tamper event surfaces on the landing page without you opening the audit viewer. A red badge means stop and investigate on the Audit page.
Keyboard navigation
Section titled “Keyboard navigation”Two hotkeys step through the signal steps — the failing, running, and blocked steps the overlay highlights — so you can triage without reaching for the mouse:
| Key | Action |
|---|---|
j | Select the next signal step |
k | Select the previous signal step |
Selecting a step moves the DAG selection and updates the Selected step card, exactly as clicking the node would.
Deep-link parameters
Section titled “Deep-link parameters”You can link straight to a specific run or step — handy for bookmarks, alert notifications, or sharing a failing step with a teammate. Append these query parameters to /dashboard:
| Param | Value | Effect |
|---|---|---|
run | a run ID | Select that run instead of the most recent one |
node | a step ID | Select that step within the run |
/dashboard?run=7c1f9a2e-...&node=build-and-testIf you omit run, the Dashboard falls back to the most recent run; if you omit node, no individual step is pre-selected.